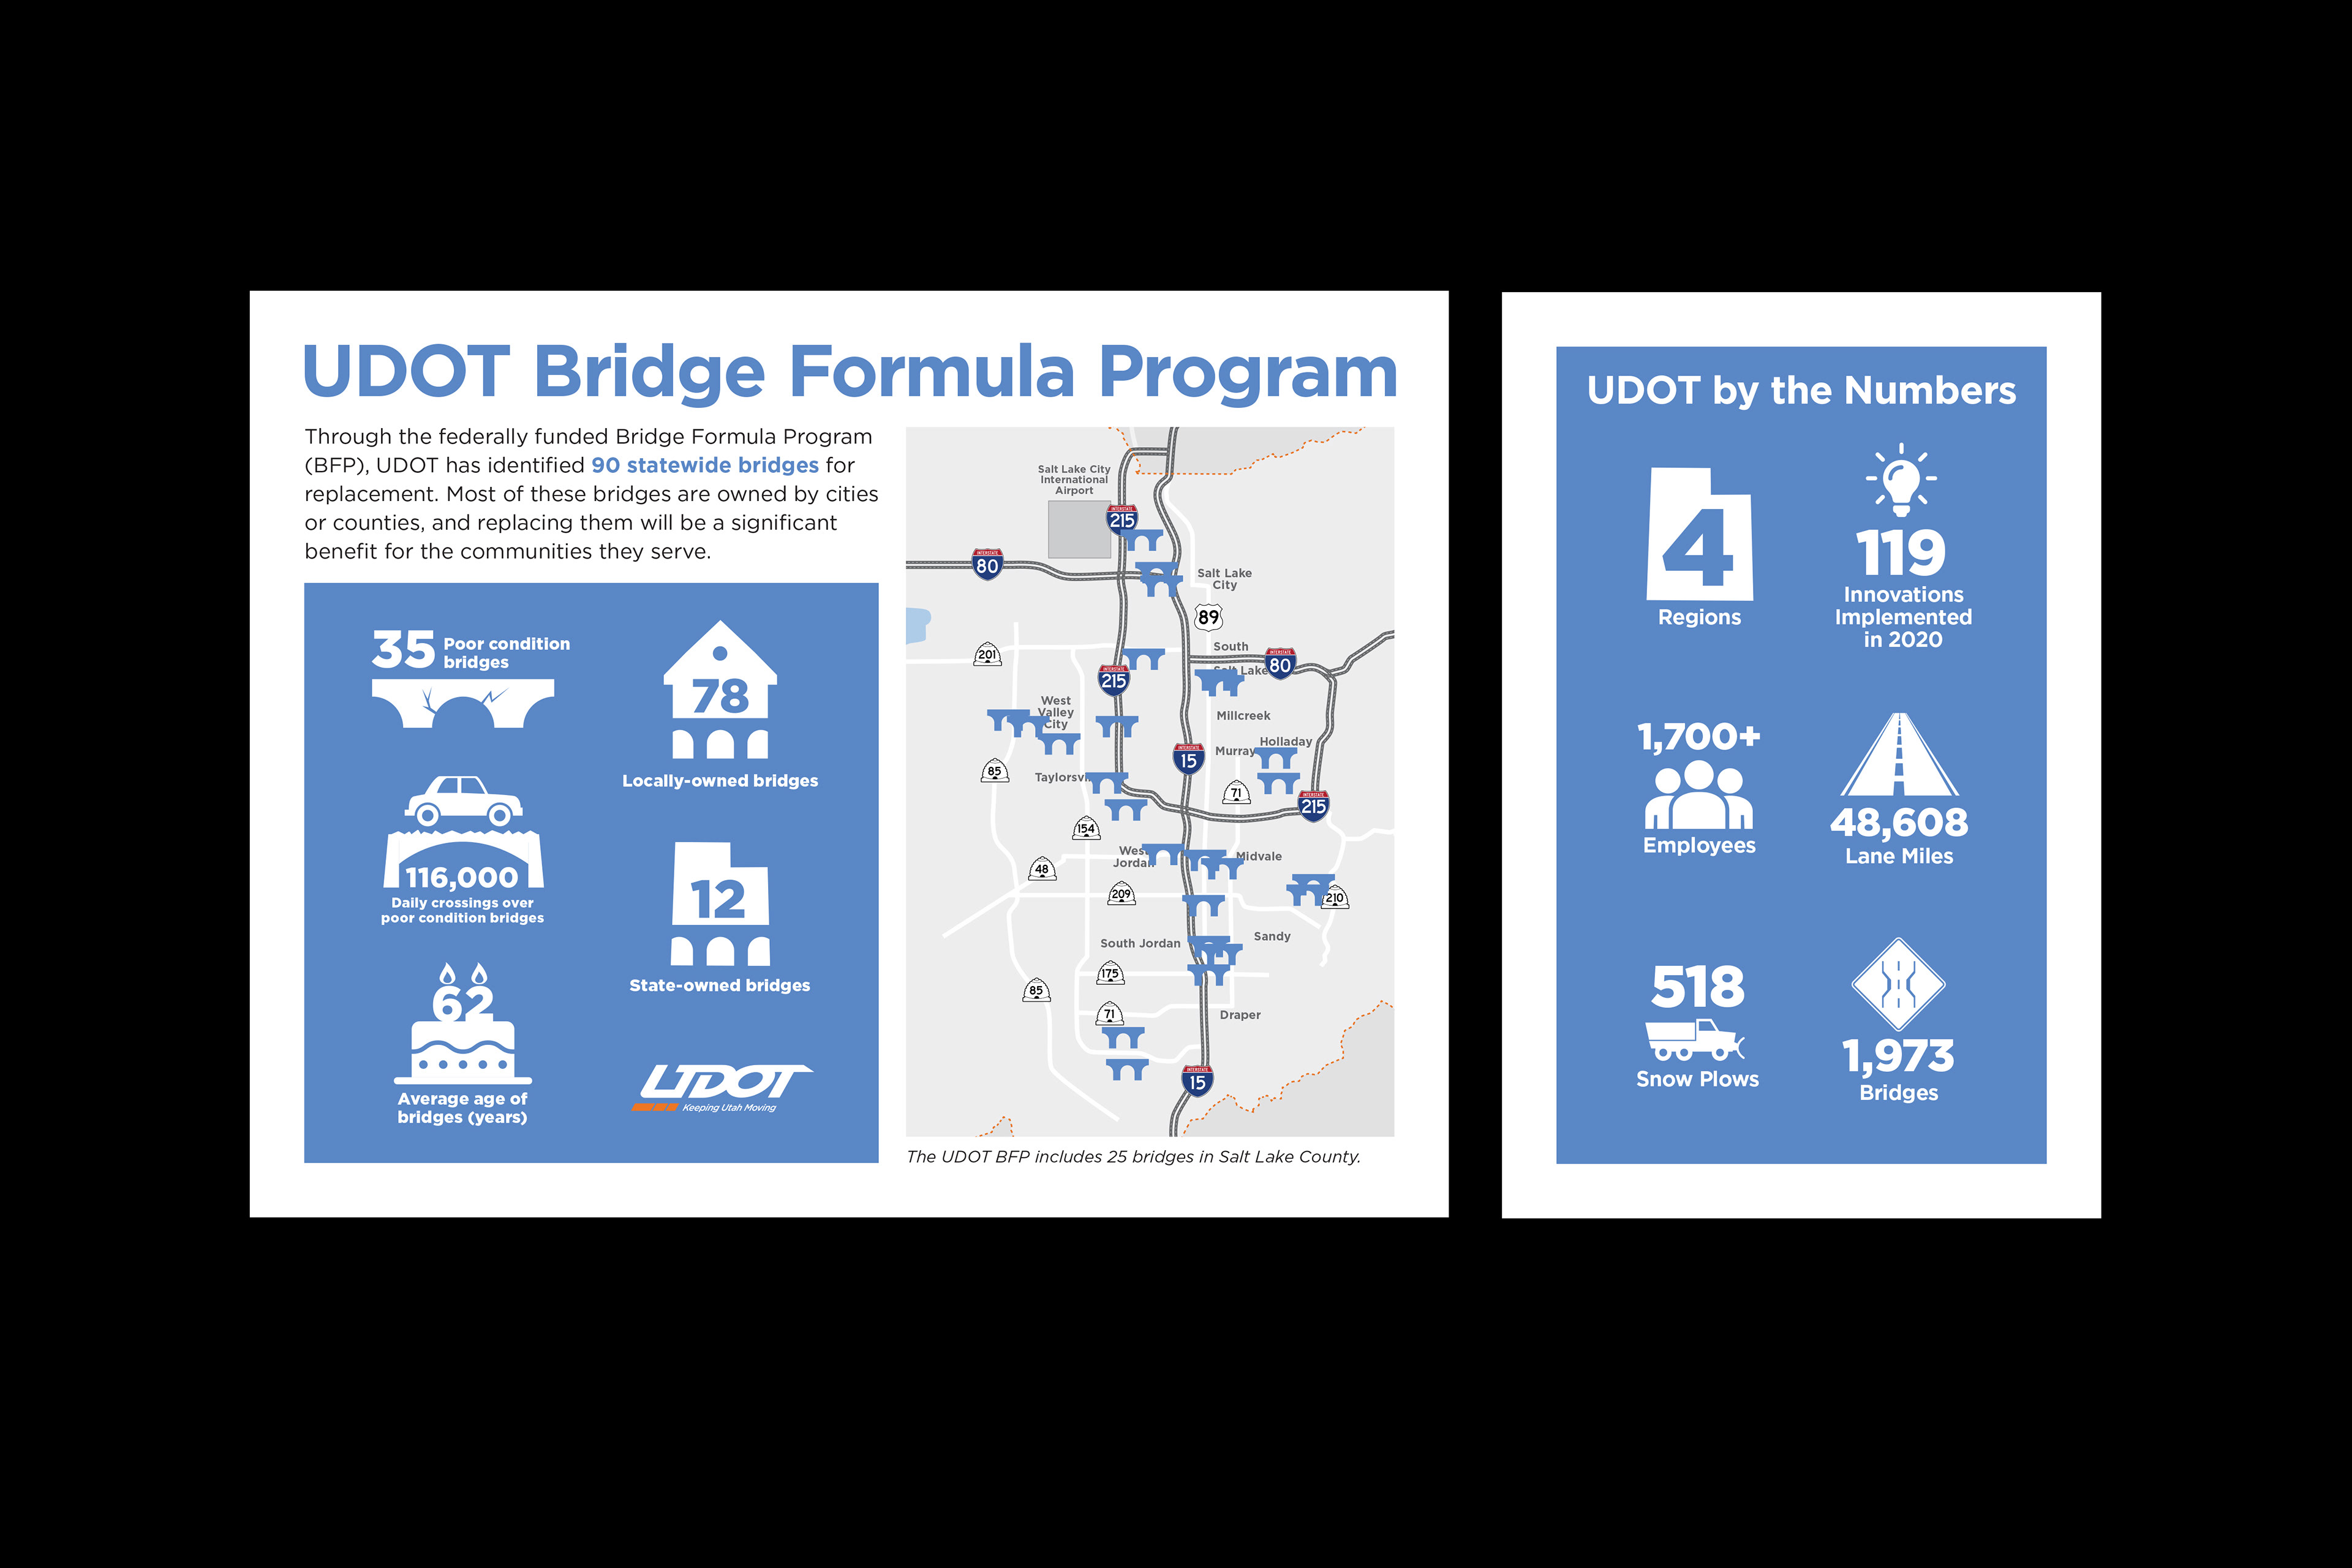


I've created several infographics for the Utah Department of Transportation through my work with Intrepid Agency. Samples below include the bridge replacement program flyer; a "UDOT By the Numbers" graphic from a legislative brochure; a diagram showing how the sky is divided for aeronautical traffic; a social media graphic highlighting various projects completed; and a before and after of a data and input diagram I redesigned.